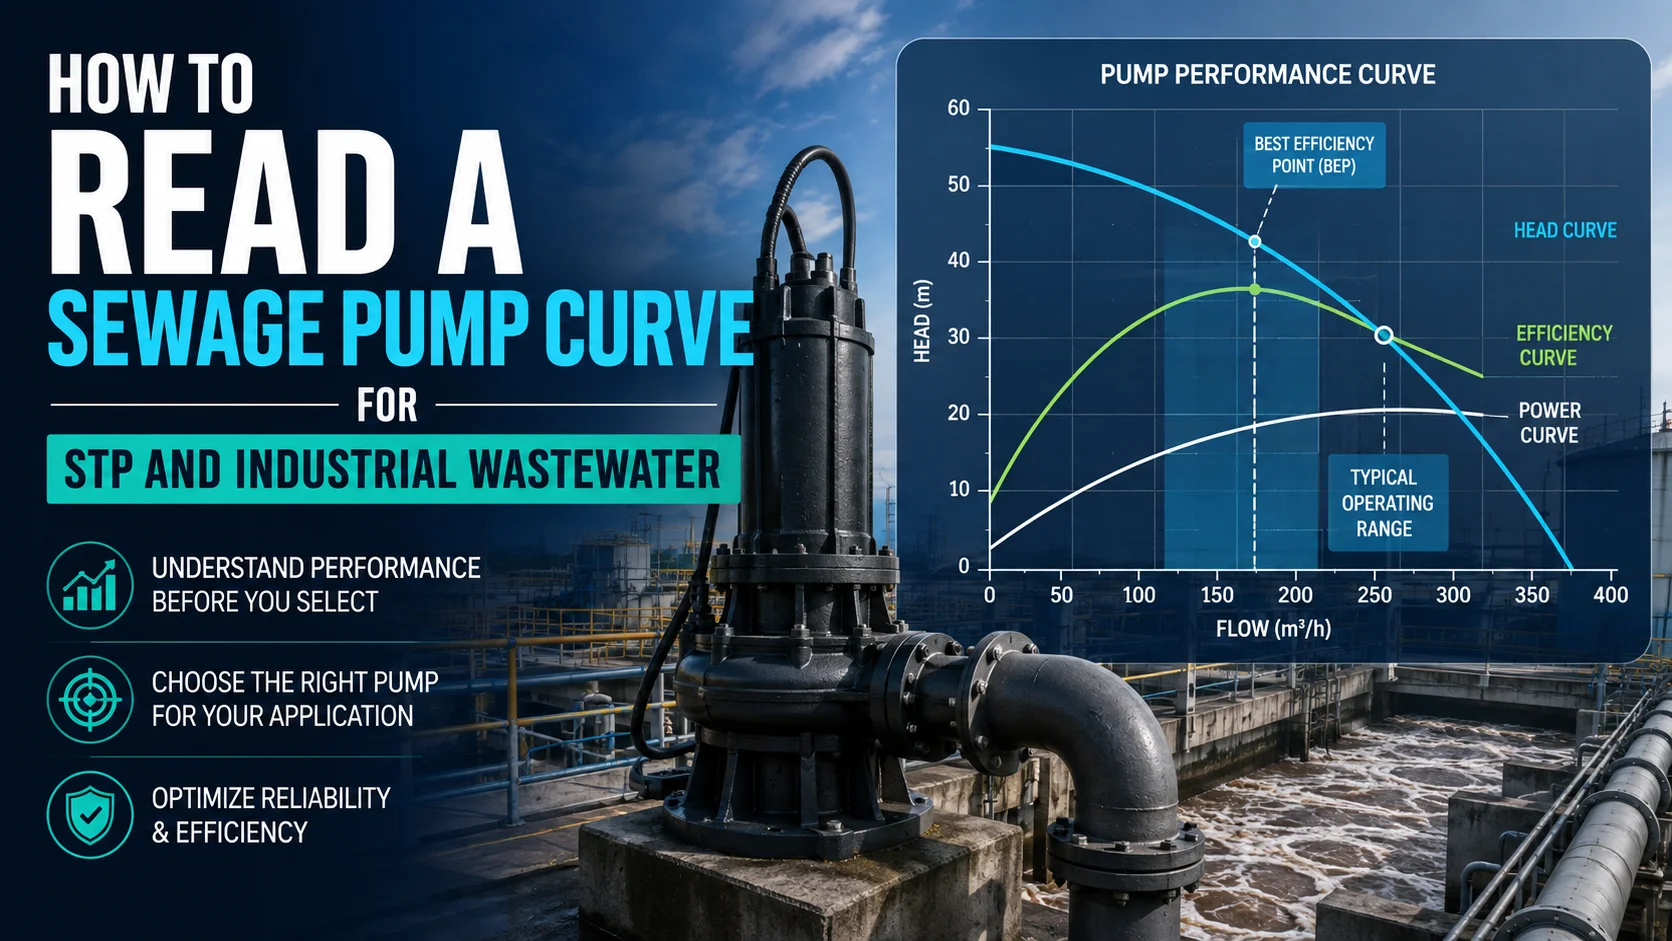
A sewage pump curve shows how much flow a pump can deliver at different levels of head.
In most centrifugal sewage pump curves:
- The horizontal axis shows flow
- The vertical axis shows head
- The curved line shows the pump's hydraulic performance
- Additional curves may show efficiency, motor power, impeller size or NPSH requirements
The correct pump should operate close to the required duty point, which is the combination of flow and total dynamic head required by the actual system.
Do not select a sewage pump only by:
- HP
- Outlet size
- Maximum flow
- Maximum head
- Pump physical size
The pump curve should be matched against the real STP or wastewater system.
What Is a Pump Performance Curve?
A pump performance curve is a graphical representation of how a pump performs under different hydraulic conditions.
A sewage pump does not produce the same flow regardless of the system.
Its flow changes depending on how much resistance the discharge system creates.
For example, one pump might provide:
- Higher flow at lower head
- Lower flow at higher head
This relationship is shown on the pump curve.
Understanding the curve helps engineers avoid selecting a pump that appears powerful on paper but cannot deliver the required flow at the actual site head.
Flow and Head: The Two Most Important Values
Before reading the curve, understand these two terms.
Flow
Flow tells you how much wastewater the pump moves during a given time.
It may be expressed as:
- Litres per second
- Litres per minute
- Cubic metres per hour
- Other engineering flow units
For an STP, the required flow depends on wastewater inflow, wet-well storage and the required pumping cycle.
Head
Head represents the resistance the pump must overcome to move wastewater through the system.
It is commonly expressed in metres.
Head may include:
- Vertical lift
- Pipe friction
- Bends
- Valves
- Reducers
- Other fittings
- Downstream pressure
The complete value is usually referred to as total dynamic head or TDH.
Where Are Flow and Head Shown on the Curve?
A conventional centrifugal pump curve generally has:
Horizontal Axis
Flow
Flow increases as you move from left to right.
Vertical Axis
Head
Head increases as you move upward.
The pump performance line slopes downward because a centrifugal pump generally delivers less flow as system head increases.
Simple Pump Curve Example
Imagine a pump curve with these approximate operating points:
| Flow | Head |
|---|---|
| 20 m³/hr | 20 m |
| 40 m³/hr | 17 m |
| 60 m³/hr | 13 m |
| 80 m³/hr | 8 m |
This does not mean the pump simultaneously delivers 80 m³/hr at 20 metres head.
Instead, the actual output depends on the system resistance.
If your project requires:
60 m³/hr at 13 metres TDH
this pump may be close to the required operating condition.
If the project requires:
80 m³/hr at 20 metres TDH
the same pump would not satisfy the requirement even though its catalogue separately shows a maximum flow of 80 m³/hr and a maximum head of 20 m.
This distinction is extremely important.
Maximum Flow and Maximum Head Should Not Be Combined
A common procurement mistake is reading a catalogue like this:
Maximum Flow: 100 m³/hr
Maximum Head: 25 metres
and assuming the pump provides:
100 m³/hr at 25 metres
Normally, it does not.
Maximum flow generally occurs toward the low-head side of the performance curve.
Maximum head generally occurs toward the low-flow side.
The actual required condition must be located on the pump curve.
What Is the Duty Point?
The duty point is the flow and head that the pumping system requires.
For example:
Required Flow: 50 m³/hr
Required TDH: 14 metres
The target duty point is therefore:
50 m³/hr @ 14 m
When comparing pumps, look for a model whose performance curve passes reasonably through that point.
This is much more meaningful than saying:
We need a 5 HP sewage pump.
Horsepower is the motor rating.
The duty point describes what the hydraulic system actually needs.
Calculate the Duty Point Before Selecting the Pump
Before opening a pump catalogue, collect:
- Required flow
- Static lift
- Discharge pipe diameter
- Total pipe length
- Pipe material
- Number of bends
- Check valve
- Isolation valve
- Other fittings
- Downstream pressure
- Wastewater solids
- Operating pattern
These values allow the total dynamic head to be estimated.
Flow Chem's Sewage Pump Sizing Guide for STP and Industrial Wastewater provides a broader sizing workflow.
What Is the System Curve?
The pump curve describes the pump.
The system curve describes the pipeline and installation.
As flow increases through a pipe, friction normally increases.
The system therefore requires more head at higher flow rates.
When both curves are placed on the same graph, they intersect.
That intersection is the actual operating point.
In simple terms:
Pump Curve + System Resistance = Actual Pump Operation
This is why installing the same sewage pump at two different sites can produce different flow rates.
Example: Same Pump, Different Sites
Suppose the same pump is installed at two STPs.
Site A
- Short discharge pipe
- Few bends
- Low vertical lift
System resistance is relatively low.
The pump may operate at a higher flow.
Site B
- Long discharge pipe
- Several bends
- Higher vertical lift
System resistance is greater.
The same pump may deliver significantly less flow.
Nothing is necessarily wrong with the pump.
The hydraulic systems are different.
Why Pipe Diameter Changes the Operating Point
A smaller discharge pipe generally creates greater friction loss.
That increases system head.
As the system curve becomes more restrictive, the operating point can move toward:
- Lower flow
- Higher head
A larger pipe may reduce friction and allow the pump to operate at a higher flow.
This is why pump selection and discharge-pipe sizing should be performed together.
What Is Best Efficiency Point?
Many pump curves show a Best Efficiency Point, commonly called BEP.
This is the region where the pump operates most efficiently from a hydraulic perspective.
A properly selected centrifugal pump should generally operate within a suitable range around its intended design region rather than being forced continuously toward an extreme end of the curve.
Operating too far from the appropriate region can contribute to:
- Increased vibration
- Poor hydraulic efficiency
- Higher energy consumption
- Bearing stress
- Seal wear
- Unstable operation
- Reduced service life
The acceptable operating range depends on the pump design and manufacturer's recommendations.
Why the Extreme Left Side of the Curve Can Be a Problem
At very low flow, the pump may be operating against excessive system resistance.
Possible causes include:
- Closed valve
- Partially closed valve
- Blocked discharge pipe
- Excessively high static head
- Incorrect pipe sizing
Continuous operation at an unsuitable low-flow condition can create internal hydraulic problems and unnecessary heating or vibration.
The exact limits depend on the pump.
Why the Extreme Right Side Can Also Be a Problem
At the high-flow end of the curve, the pump may be moving significantly more liquid than intended.
This can happen when system resistance is lower than expected.
Possible results include:
- High motor loading
- Increased current
- Cavitation risk under certain conditions
- Reduced efficiency
- Increased hydraulic wear
- Unstable operation
A pump should therefore not simply be selected because the required point falls somewhere below its maximum capacity.
The position on the curve matters.
Understanding Efficiency Curves
Some pump charts include efficiency contours or efficiency lines.
These indicate how effectively the pump converts motor energy into hydraulic output at different operating points.
Higher efficiency can reduce long-term electricity consumption.
This becomes especially important for:
- 24/7 STPs
- CETPs
- ETPs
- Municipal sewage pumping stations
- Industrial wastewater transfer systems
For intermittent emergency pumping, energy may be less dominant than reliability.
For continuously operating pumps, even modest efficiency differences can affect lifecycle operating costs.
Understanding Power or Motor Load
A pump curve may also show:
- Power requirement
- Shaft power
- Motor loading
The selected motor should be suitable for the expected operating range.
If the actual operating condition causes the pump to demand more power than the motor can safely provide, operators may experience:
- Overload trips
- Motor overheating
- Higher current
- Shortened motor life
This is another reason the real system operating point should be checked.
What Does Impeller Diameter Mean on a Pump Curve?
Some pump families use different impeller diameters within the same pump casing or model range.
The curve may therefore show several performance lines.
A larger or differently trimmed impeller can change:
- Flow
- Head
- Power requirement
- Operating region
Always confirm which curve corresponds to the actual supplied pump.
Do not compare a duty point against a curve for a different impeller configuration.
Pump Curve Selection for Sewage Is More Than Hydraulics
A pump can match the required flow and head but still be unsuitable for sewage.
You must also verify:
- Maximum solids passage
- Impeller type
- Ragging risk
- Fibrous waste
- Sludge concentration
- Abrasion
- Wastewater chemistry
- Material construction
- Mechanical seal arrangement
- Duty cycle
- Motor protection
A hydraulically correct clean-water pump is not automatically a correct sewage pump.
Solids Can Change Pump Performance
Raw sewage may contain:
- Rags
- Wipes
- Organic solids
- Plastics
- Fibres
- Sludge
- Grit
These materials can cause partial blockage or impeller wear.
As the hydraulic passages become restricted, the pump's real performance can move away from its original clean-water performance curve.
This is why operational monitoring is important.
If a pump previously delivered the required flow but performance gradually falls, investigate the complete system before immediately installing a larger motor.
Selecting the Correct Impeller Type
The pump curve tells you hydraulic capacity.
The impeller tells you a great deal about solids-handling behaviour.
Depending on the sewage characteristics, applications may use designs such as:
- Semi-open impellers
- Vortex impellers
- Non-clog impellers
- Cutter arrangements
For general raw sewage and sludge duty, review Flow Chem's Submersible Sewage and Sludge Pump range.
For wastewater containing significant rags and fibres, compare the application against a Submersible Cutter Pump.
Pump Curve Selection for Duty/Standby Systems
Many STPs use two pumps:
- One duty
- One standby
If only one pump operates at a time, each pump should be capable of meeting the required duty point.
But some stations allow the standby pump to assist during peak inflow.
If both pumps operate together, the system does not automatically receive exactly double the flow.
Why?
Because the increased combined flow also increases pipe friction.
The system operating point changes.
Parallel pump operation should therefore be checked against:
- Individual pump curves
- Combined pump curve
- System curve
- Common-header capacity
Pump Curve Selection with a VFD
A Variable Frequency Drive can change pump speed.
Changing speed also changes pump performance.
Reducing speed generally reduces:
- Flow
- Head
- Power demand
This makes VFDs useful where wastewater flow varies significantly.
However, simply installing a VFD does not automatically improve the system.
Engineers should consider:
- Minimum pump speed
- Solids movement
- Motor cooling
- Wet-well levels
- Minimum discharge velocity
- Control logic
- Pump operating range
Very low operating speeds can be problematic in sewage systems if solids are no longer transported effectively.
Why Oversizing a Sewage Pump Is Not a Safety Margin
Some buyers intentionally select a much larger pump because they believe extra capacity is safer.
That can create problems.
An oversized pump may:
- Empty the wet well too quickly
- Start and stop frequently
- Increase energy consumption
- Operate away from its preferred hydraulic region
- Create excessive discharge velocity
- Increase water hammer
- Require larger electrical equipment
Pump selection should provide sensible engineering margin, not uncontrolled oversizing.
Why Undersizing Is Equally Risky
An undersized pump may appear to work during normal inflow but fail during peak conditions.
Possible consequences include:
- Rising wet-well level
- Continuous pump operation
- Overflow risk
- Motor overload
- Inability to achieve required transfer rate
- Standby pump running continuously
The pump curve should therefore be checked against the design duty and credible peak operating conditions.
Common Pump Curve Reading Mistakes
1. Selecting by HP
Two pumps with the same motor HP can have very different hydraulic performance.
2. Combining Maximum Flow and Maximum Head
These normally occur at different locations on the curve.
3. Ignoring Total Dynamic Head
Static lift alone does not describe the complete system resistance.
4. Ignoring Pipe Diameter
Pipe friction can significantly change the operating point.
5. Selecting at an Extreme End of the Curve
A point technically touching the curve may not represent a desirable continuous operating condition.
6. Ignoring Solids
A pump that matches flow and head may still clog in actual sewage.
7. Ignoring Multiple Pump Operation
Two pumps in parallel do not necessarily provide exactly twice the single-pump flow.
8. Ignoring Actual Site Changes
Longer pipes, additional bends or different valves can change the operating point after the original selection.
Practical Sewage Pump Curve Selection Example
Suppose an STP requires:
Required Flow: 45 m³/hr
After calculating:
- Static lift
- Pipe friction
- Bend losses
- Check valve loss
- Isolation valve loss
the total dynamic head is determined to be:
12 metres
The target duty point is therefore:
45 m³/hr @ 12 m TDH
Now compare this point with candidate pump curves.
Pump A
At 12 metres head, it provides approximately 30 m³/hr.
Result: Too little flow.
Pump B
At 12 metres head, it provides approximately 45 m³/hr near its intended operating region.
Result: Potentially suitable, subject to solids, materials, motor and other checks.
Pump C
At 12 metres head, it provides approximately 90 m³/hr.
Result: Potentially oversized for the required duty.
This simple comparison is much more reliable than selecting only from motor horsepower.
What Information Should You Send a Pump Manufacturer?
For accurate sewage pump selection, provide:
- Required flow
- Static head
- Total dynamic head if calculated
- Pipe diameter
- Pipe length
- Number of bends
- Valve details
- Wastewater type
- Maximum solid size
- Rag and fibre content
- Sludge concentration
- Temperature
- pH or chemical characteristics where relevant
- Number of pumps
- Duty/standby requirement
- Daily operating hours
- Electrical supply
The better the site data, the better the pump selection.
Sewage Pump Curve Selection Checklist
Before approving a pump, confirm:
- Required flow
- Total dynamic head
- Duty point shown on curve
- Actual curve for selected model
- Impeller configuration
- Operating region
- Efficiency
- Motor power requirement
- Pipe diameter
- Pipe friction
- Valve losses
- Solids passage
- Impeller type
- Wastewater chemistry
- Pump material
- Mechanical seal arrangement
- Continuous/intermittent duty
- Number of operating pumps
- Common header arrangement
- VFD operation if applicable
- Maintenance requirements
Frequently Asked Questions
What does a sewage pump curve show?
It shows how the pump's flow changes as the required head changes. Additional information may include efficiency, power requirement and impeller configuration.
What is the duty point of a pump?
The duty point is the required combination of flow and total dynamic head for the actual pumping system.
Can I select a sewage pump only by HP?
No. HP is the motor rating. Two pumps with the same HP can provide very different flow and head performance.
What is the difference between maximum head and operating head?
Maximum head is an extreme value on the pump curve. Operating head is the head the pump actually experiences at the system operating point.
Can maximum flow and maximum head be achieved together?
Normally no. They occur at different positions on a centrifugal pump performance curve.
Why does my pump provide less flow than the catalogue maximum?
The catalogue maximum may be measured at much lower head. Your real installation has static lift, pipe friction, fittings and valves that increase system resistance.
What is BEP in a pump curve?
BEP means Best Efficiency Point. It represents the region where the pump operates with high hydraulic efficiency. Pumps are generally selected to operate within an appropriate range around their intended design region.
Does changing pipe diameter change pump flow?
It can. Changing pipe diameter changes friction loss and therefore changes the system curve and actual pump operating point.
Do two pumps in parallel provide double the flow?
Not necessarily. Combined flow increases system friction, so actual performance should be calculated using the combined pump and system curves.
Need Help Matching Your Pump Curve to the Actual STP Duty?
The correct sewage pump is not simply the model with the largest motor, maximum flow or maximum head.
It is the pump that can reliably deliver the required flow at the actual total dynamic head while handling the wastewater solids and operating conditions.
For application-based selection, share your:
- Required flow
- Head
- Pipe diameter
- Pipe length
- Wastewater type
- Solids
- Duty cycle
- Number of pumps
- Site layout
with Flow Chem Pumps.
Explore the Flow Chem Submersible Sewage and Sludge Pump range for STP, sewage, sludge and industrial wastewater pumping applications.